If we don’t win, you don’t pay.
NO WIN – NO FEE

ON CALL 24/7
U.S. Marine
GET A FREE-ANGLE ACCIDENT CONSULTATION
Have you or your loved ones suffered a severe injury during a Los Angeles car accident at a red light, stop sign, or green or yellow light? Did your primary wage earner suffer a wrongful death during an intersection accident? If so, these seriously injured survivors may be entitled to seek personal injury compensation.
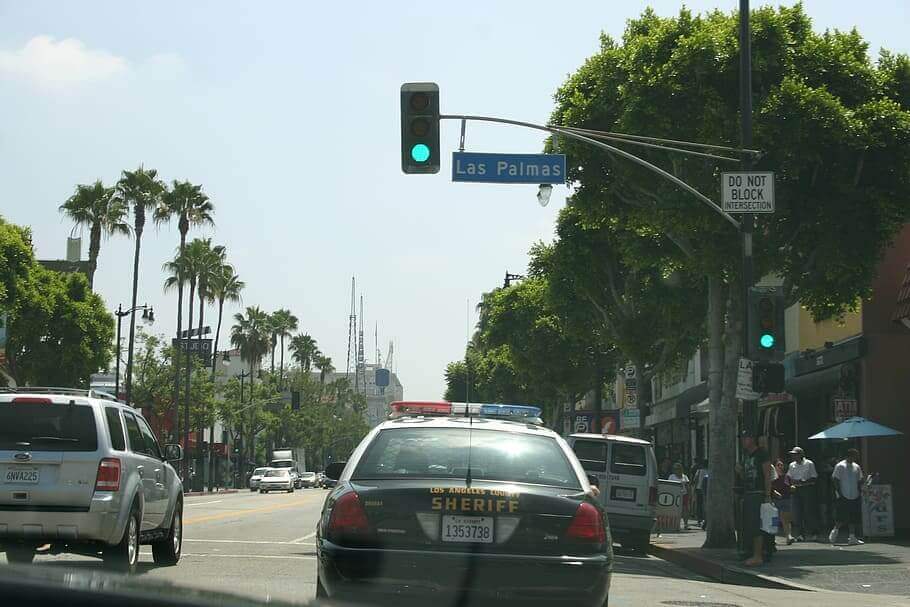
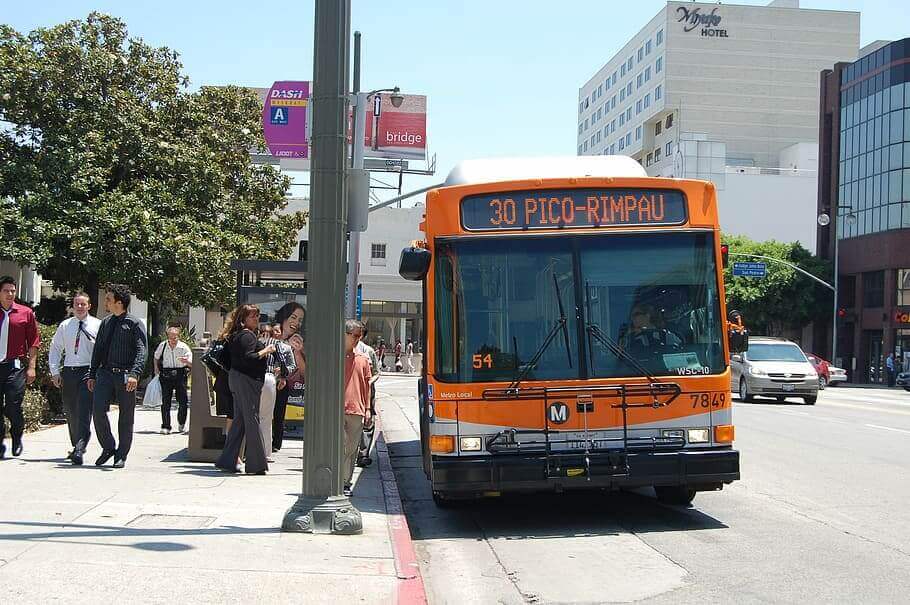
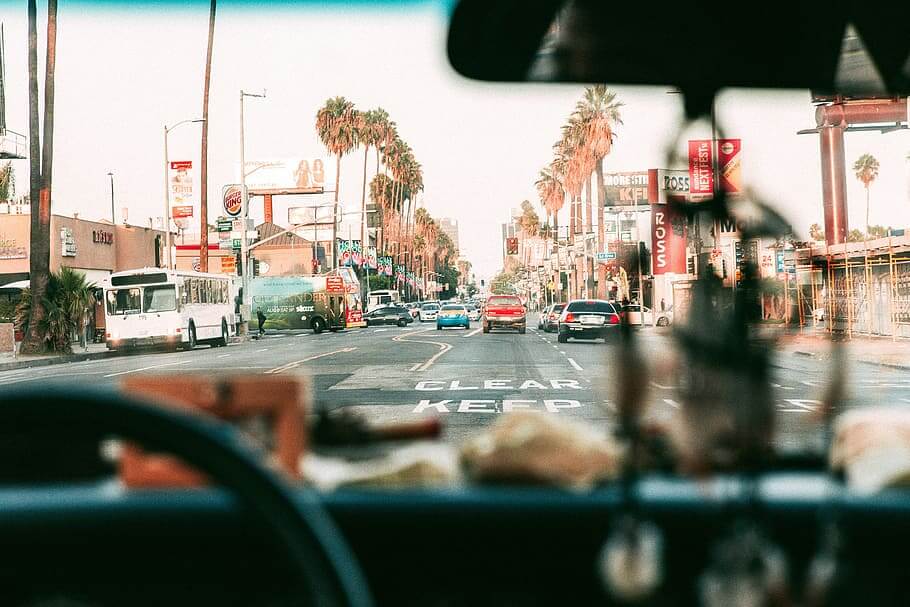
Our Los Angeles auto accident attorneys help seriously injured victims win all sorts of intersection accident court and insurance claims. Intersections are the at-grade junctions where most traffic accidents occur. Los Angeles has some of the most dangerous roads and intersections in the United States.
Modernly, these types of roadway collisions compose almost 40% of U.S. annual vehicle accidents. Typically, another vehicle will collide with the front or rear quarter panel or your vehicle’s front or rear doors. Most of our accident claims will involve collisions occurring at yellow signals phasing to a red light. If you have driven in L.A., you also know that many aggressive motorists running behind think they can speed through a traffic intersection to beat a yellow light and avoid an auto accident. Also, many children get run over at stop signs in school zone crosswalks by speeders, drunks, and inattentive drivers.
Adding to your commuting frustration, for example, not all four-way stops and traffic intersections are controlled by a traffic signal phasing from yellow to red to green. You may have noticed signal phasing problems giving other oncoming drivers the green light. Also, some stop signs might be poorly lit, missing, or faded.
- What you do the first 24 hours of crashing your car at an intersection will be decisive.
- You or your loved one could obtain an award similar to a windfall or collect zero damages award at all for your auto accident.
- We understand the devastating effects of a car accident.
Our Los Angeles personal injury attorney offers victims a free consultation. After we attentively listen to your problems. Once you hire our winning team of paralegals and attorneys, you will have experts helping you. We have the know-how to deal with these situations and other personal injury claims.
Why Should I Hire Los Angeles Intersection Accident, Lawyers?
Victims seriously injured in an intersection auto collision must seek legal advice before assuming the other side will be responsible for covering severe injury and wrongful death consequences. However, most of the time, you will battle tooth and nail just to get adequate property damage coverage, let alone money for your medical expenses and time off work.
Our Unmatched Reputation As Intersection Accident Lawyers
- We are known and respected by courts and insurance companies for honesty, promptness, and fair dealing.
- We have assisted thousands of individuals seeking legal advice in civil negligence cases.
- We have a proven track record of success as one of the best personal injury attorneys in Los Angeles.
- We are recognized as consumer rights lawyers in LA Times, Newsweek Magazine, and CNN.
- We have a tradition of giving back, lobbying both congress houses, and drafting legislation pro bono as a charitable contribution.
- Our charismatic listening team has over 15 years of legal experience.
- We have won happy clients $150 million in insurance settlements and verdicts.
- We have over 15 convenient, local California offices from San Diego, Orange County, San Bernardino, Riverside, Fresno, San Francisco, and Sacramento.
Here is What Great Car Accident Lawyers Know!
You must meet your “preponderance of the evidence” burden of proof. You must establish a 51% or more likely that your version or recollection or that of your expert witness is correct. Since you are not a trained trial attorney, you don’t know the evidence and procedure rules. Your lack of legal experts will make it extremely difficult to convince an adjuster or jury to follow instructions.
Unless you (or your personal injury attorney) takes the necessary steps to build your accident case, you could lose out on total compensation. Our experienced Los Angeles intersection accident attorneys have insider, winning knowledge. We make it happen for you!
-
A Well Trained Car Accident Lawyer Knows You Must Seek Out Evidence Because:
The insurance company is not your friend: Contrary to what an insurance adjuster may tell you, to prevail, you must show it’s more likely than not that the other car ran through the intersection unlawfully. To do that, you’ll need some evidence establishing the plaintiff’s obligatory burden of proof.
The Other Driver Will Probably Lie: After the other driver speaks to their insurance agent, they will typically finger you as the at-fault party, even if they previously admitted fault.
The Insurance Company Will Probably Refuse Liability Acceptance: Because the other driver now has amnesia or a false version of events, their insurance company will refuse to accept compensation responsibility until you establish legal liability.
The Cops May Blame YOU: If no witnesses perceived or saw the accident occur, and both drivers say the yellow or green light favored them, the LAPD or CHP might place both parties at fault! Because of this, the law-abiding driver will become hard-pressed to convince a well-trained insurance adjuster they should pay your bodily injury claim.
So how do you deal with a liar or someone who “misremembered?” How, for example, does a motorcycle accident attorney win a case when biased police officers wrongly placed them at fault for the traffic wreck? How can a lawyer help this victim receive monetary damages? Our job is to convince the insurance company that a jury will believe it’s more likely than not the other party caused the accident.
Our Superior Intersection Accident Lawyers Will:
-
Gather Evidence:

We will take steps to identify the liable party immediately. For example, sometimes both sides will claim they had the “green light” or argue over who had the right way. But you will face problems establishing party fault without a dashcam or some videotaped footage. You will be facing a “he said, she said” situation with a court splitting the baby, so to speak. Your whole case hinges on your lawyer finding proof.
-
Handle the Insurance Settlement Negotiations:
We will begin your insurance claims process. You already know most intersection accidents will generally see the front bumper of one of the vehicles collide with another person or object.
-
Help With Medical Care Experts:
We can help you find a lien doctor to treat you now and get paid back after winning.
-
Advance Accident Case Costs:
We will cover upfront costs for ordering and obtaining police reports, medical bills/medical treatment records, and expert witnesses when necessary.
-
Offer a Free Consultation 24/7:
We charge you nothing upfront to hear what you have to say and give you an honest civil case assessment over the phone 24 hours a day, seven days a week.
-
Offer a No Win No Fee Promise:
That’s right, we believe in your case so much; if we can’t win, we take no attorney’s fee! We think you deserve nothing less than the best personal injury attorney in Los Angeles. We put our money where our mouth is.
Top Injury Lawyer in Los Angeles, California By Reviews, Results, And Service
“I don’t know who could have given me better legal assistance for my intersection accident rear-end collision while riding my motorcycle. The cops and the other side tried blaming me, but Mike and his staff turned it around my car crash lawyer. I will recommend anyone hurt in a car accident case, reach out to Ehline Law Firm!” – Ryan E., San Diego, Camp Pendleton, CA
What Are The Two Most Common Los Angeles Intersection Types?
 Generally, our Los Angeles intersection accident attorneys help victims with accidents occurring at two main types of intersections:
- Signalized intersections: Electronic signals help guarantee the most efficient traffic flow. Stationary stop signs generally force each car to stop, creating more bottlenecks. (Combinations of painted signs with flashing caution lights also exist.)
- Unsignalized intersections: Traffic engineers and accident attorneys classify intersections by their amount of road segments, traffic controls, or lane designs. Anywhere you see two or more roads, streets, or chokepoints cross, you will observe numerous risks and hazards to motorists, bicyclists, motorcycle riders, and pedestrians.
What Are The Most Common Los Angeles Intersection Collision Types?
As discussed, intersection accidents are collisions at roadway intersections, including vehicle vs. vehicle or vehicle vs. pedestrian at a crosswalk.
An intersection crash will commonly take a variety of different forms, including:
-
- T-Bone Accidents/Broadside/Side Impact: T-bone accidents remain the most common intersection accident type. These crashes can be characterized by one vehicle hitting the other from its side, forming a T-like shape at the point of impact. Vehicle occupants are provided with far less warning and security when the rear or front quarter panels get hit. Also, airbags are not designed to open unless your front bumper collides head-on. Statistics show that most broadsides happen when one vehicle fails to yield to the other. Most cases we litigate are left-hand turn cases where one driver is proceeding straight through the intersection as another vehicle turns left. You and your vehicle occupants will have no bumper barrier. And even side impact airbags won’t stop serious injuries when another vehicle strikes the vulnerable front or rear side passenger or driver’s side doors. Seatbelts are least effective due to the side-to-side, resulting in g-forces. Learn more from a T-Bone accident lawyer.
- Left-Hand Turn Collisions: This is the number two most common traffic accident in LA. We all know making a left-hand turn at an intersection comes with some stress. Many drivers in LA become impatient or angry. Some vehicle operators become distracted, with many drivers failing to check properly for oncoming vehicle traffic speeds, distances, and travel direction. Many cities in Los Angeles began installing arrow signals at intersections, but Los Angeles is still the world’s intersection accident capital!
- Sideswipes: These cases generally involve a near-miss left turn or another car suddenly switching lanes from left to right or right to left at or near an intersection. These are pretty common and also become disputed liability claims in many cases. Our superior California intersection injury law firm will take steps to prove your case when a driver collides with your car.
- Head-On Collisions: Head-on collisions remain less common with intersection injury claims, and are more typically associated with wrong-way driving. But we have seen more head-on severe collisions involving drugged, intoxicated, distracted, dehydrated, or fatigued autoists. Our lawyers have seen a rise in COVID-19 wrong-way accidents.
- Rear-End Accidents: Rear-end crashes occur more frequently than any other car accident type. Most rear-end collisions involve distractions at or near intersections. When you get hit in the rear at an intersection, typically, the rear driver assumed you would proceed through the intersection and not turn left or right, for example. Often, the rear vehicle driver was following too closely. The rear vehicle operator often failed to anticipate the sudden stops many drivers will make close to an intersection for a yellow light. When you get hit from behind, the rear driver may even try and blame you, claiming their interpretation of the Vehicle Code applied. When you fail to notice the light phased green immediately, you could also be rear-ended by an aggressive, pushy driver behind you.
- Right-Turn Accidents: Mostly, these cases happen when a driver fails to stop at a limit line or crosswalk at a red light and yield the right-of-way to a pedestrian. From 2018-2020, estimates indicate drivers caused 319 red light right turn accidents, making up 5.15% of L.A. intersection collisions. These accidents typically involve a motorist, bicyclist, or pedestrian crossing the intersection parallel with the vehicle making a right-hand turn. Since people on foot and bikes present smaller targets, the car failing to yield veers directly into the victim’s left side, likely in the car driver’s blind spot. (See CVC § 21453).
- Illegal U-Turn Accidents: These are also fairly common crashes in commercial zones and tourist areas near Disneyland, Knott’s Berry Farm, or Santa Monica. These collisions often occur when a driver making a right turn on a green light at an intersection is T-boned by another vehicle in making a left, rearward-facing U-turn into the opposite direction of traffic. But it also happens that pedestrians and e-scooter and bicycle riders get hit in crosswalks too. Our Los Angeles U-Turn accident attorneys explain more here.
- Sidewalk/Cross-Walk Accidents: People getting run over on sidewalks and crosswalks are also very common in dense city areas, including Los Angeles. Our superior cross-walk accident attorneys dedicated a discussion to the problem here.
- Hit and Run: Many hit and runs happen when a drunk person blows a red light and crashes into people or objects at intersections. Other times, the other driver is uninsured, unlicensed, or scared. Either way, we help you make Underinsured and Uninsured motorist claims and take steps to find the criminal fleeing the accident scene.
Statistics: What Are Some Common Causes of Intersection Accidents?
The two most common causes of intersection accidents are:
- Driver error: According to NHTSA accident statistics, driver error is a leading cause of intersection crashes in a personal injury cases (approximately 96%). Driver hurry, rush or inattention while crossing through traffic signals, stop signs, or un-signalized roads remains the number one culprit.
- Dangerous road conditions: Typically, these are caused by government negligence or big rig trucks spilling loads.
Why do so many traffic accidents happen at Los Angeles intersections?
Our accident attorneys have first-hand knowledge of dangerous drivers and dangerous road conditions leading to most intersection collisions. Although most intersection accidents remain preventable, sometimes, these catastrophes are wholly unavoidable. In Los Angeles, California, “angle crashes” present real threats to anyone sharing roads. An angle crash happens when two vehicles approaching opposite roadways collide at a junction point, including a highway intersection, driveway, offramp, or entrance ramp.
- Driver Negligence and Red or Yellow Light Accidents
Negligence: Most intersection accidents are the result of driver negligence. All drivers on the road have an obligation to drive safely. This requires obeying all posted traffic laws, understanding responsibilities at an intersection, and using caution to prevent the risk of harm. When drivers do not uphold their duty of care to others, they can be held financially responsible for injuries.
Common causes of dangerous/reckless/negligent driver intersection accidents include:
- Turning your car with your view obstructed:
- Running a yellow/red traffic light or static stop sign: You already know you must slow to a complete stop at a yellow light unless you are past the point of no return. California’s Vehicle Code requires you to completely stop your car at a red light or stop sign. (Ex: Some negligent drivers will make a right-hand turn at an intersection, rolling through a red light without stopping). Drivers, especially bus and truck operators who do not stop at a signalized traffic intersection before turning, won’t have sufficient time to analyze traffic conditions presented. A California Stop Accident is another example where drivers don’t take time to see whether continuing through an intersection is safe. However, coming to a stop is only a part of the law. You must exercise common sense to remain safely protected on the roads while driving.
- Driving Too Fast/Speeding For Safe Conditions: Most severe injury or death claims involve driving too fast, along with the others listed here.
- Failure to Yield Right-Off-Way: In Los Angeles, from 2018-2020, the CHP estimates that driver’s failure to yield right-of-way caused 3,666 pedestrian accidents at a marked or unmarked crosswalk making up 59.13% of intersection collisions. Failure to yield generally presents itself in cases involving excessive speed, with drivers trying to beat a yellow traffic light. Many drivers become aggravated during rush hour after sitting through hours of red signals. We have all seen these drivers speed through an intersection while trying to beat the light before it flashes red. These dangerous drivers, lucky enough to survive, cause other drivers to take evasive action, leading to crashes involving pedestrians in crosswalks. You must never speed up trying and turning before the light changes to red under CVC § 21950.
- Driving while distracted (Distracted driving includes texting behind the wheel or talking on your smart-phone)
- Driving while under intoxicating substances(including drunk driving and drugged driving using illegal or prescription drugs)
- Aggressive driving/road rage (Los Angeles and road rage are inextricably linked).
- Drowsy or fatigued vehicle operation (Many experts believe Tiger Woods was asleep at the wheel when he passed through an intersection headed down Hawthorne Blvd., in Rancho Palos Verdes, CA.).
- Misjudging gaps in traffic or an approaching motorist’s vehicle speed while you are turning left (Motorcycle riders, in particular, remain at great risk for being squashed while lane sharing when vehicles misjudge gaps in traffic during a left-hand turn incident).
- Gullibility, by incorrectly thinking a bicycle rider or pedestrian will right turn yield to you at a stop sign or crossing signal, for example.
- Other illegal driving maneuvers like making improper U-turns, street racing, drifting, driving with high beams or bright lights, etc. These cases can cause significant car accident injuries.
Common causes of dangerous/hazardous road intersection accidents include:
Faulty traffic signal device collisions due to faulty traffic signals, including signs and lights, are a major problem in Los Angeles. Imagine the signal phasing giving both parties the green light resulting in a vehicle pile-up. The city will deny anything was wrong, so how can you win? Witnesses can change things. But absent some type of proof, good luck proving party’s fault. And you will find it more complicated if the traffic signal location maintained zero records of traffic light phasing or triggering. Again, this is why you need an aggressive, no-nonsense law firm by your side.
- Poor, unlit, or non-existent stationary traffic control signage: (including “yield,” “speed limit,” “construction zone,” etc.)
- Road debris, fallen objects, obstructions: Typically, leftover debris and road obstructions like fallen trees from bad weather, roofing shingles, screws, nails, unmarked ditches, and sewage leftovers from prior crashes can create slippery, invisible obstructions, especially for motorcycle riders and bicyclists.
TIP: If you suspect your intersection accident would not have happened but for a substantially changed or poorly maintained road hazard listed above, you can make a government compensation claim (Tort claim). Our tort claims act attorneys would typically file an official claim form with the agency, the municipality, or the party responsible for road repair and maintenance (Discussed more below).
Statutory And Common Law Driver Responsibilities At Vehicle Intersections
Most intersection accidents involve someone failing to obey red and yellow traffic lights. Many drivers remain unaware of their obligations at an intersection due to Vehicle Code ambiguities. Basically, we are required to drive reasonably, what that means can mean many things to many people. California law provides motor vehicle operators with some guidance about drivers’ expectations when facing a yellow or red traffic sign or signal.
Circular Yellow Traffic Lights – CVC § 21452
Yellow Light or Flashing Yellow? No unambiguous rules exist concerning yellow traffic signaling devices and driver response duties. When you face a steady yellow light, California law explains that a yellow traffic light means that “a red [light] indication will be shown immediately thereafter.” This change can happen in a matter of seconds. Motorists must exercise caution by slowing early when approaching a yellow traffic signal.
Red Traffic Signaling Devices – CVC § 21453
-
- [When drivers are] Stopping at a red light or other red traffic signaling device:
“(a) A driver facing a … red signal [must] stop … before entering the crosswalk … of the intersection … before entering the intersection, and shall remain stopped until … [SAFE].”
-
- Stopping And Yielding Before Turning:
“(b) [If no] sign is in place prohibiting a turn,… after stopping … facing a … red signal, [you] may turn right, … [or] left from a one-way street onto a one-way street. A driver making that turn shall yield the right-of-way to pedestrians … within … crosswalk and … vehicle … approaching … and … continue to yield the right-of-way to that vehicle until the driver can proceed with reasonable safety.”
-
- No Turning On Red Arrows:
“(c) A driver facing a … red arrow signal shall not enter the intersection … unless … permitted by another signal, shall stop … before entering the crosswalk … and shall remain stopped until [SAFE].”
The bottom line is whether or not a clearly marked limit line exists near a footpath, where two or more roads or streets meet, or cross, or not,
CVC § 21454 Contains Most Intersection Traffic Signal Rules For Drivers
“When lane use control signals are placed over individual lanes; those signals shall indicate and apply to drivers of vehicles as follows:
(a) Green indication: A driver may travel in any lane over which a green signal is shown.
(b) Steady yellow indication: A driver is thereby warned that a lane control change is being made.
(c) Steady red indication: A driver shall not enter or travel in any lane over which a red signal is shown.
(d) Flashing yellow indication: A driver may use the lane only to make a left turn to or from the highway. (Some Los Angeles traffic signals will display a flashing yellow signal or arrow. Drivers are permitted to use these lanes to perform left-hand turns. The driver must yield to all oncoming traffic and pedestrians. Left-hand turns can only be executed when the driver has reason to believe that the turn can be executed safely.).” (See also CVC 21454).
Four-Way Stop Left Vehicle Turn Yields? – CVC § 21800
Who has the legal right of way when an intersection has multiple stop signs? When two vehicles simultaneously enter an intersection from different highways, the vehicle’s driver on the left remains legally obligated to yield the right-of-way to the vehicle on their immediate right. But the driver of any vehicle on a “terminating highway” shall yield the right-of-way to any motorists approaching the intersecting, continuing highway.
Sometimes an intersection will be equipped with multiple stop signs rather than changing traffic signals. Anytime a vehicle operator approaches a stop sign, they remain legally obligated to completely stop with their vehicle’s front behind the limit line, if any.
Non-Intersection Highway Entryways And Pathway Crossings? – CVC § 21804
Sometimes drivers will need to enter or cross a highway from a road or drive not marked by traffic signals.
Under CVC § 21804:
“(a) The driver of any vehicle about to enter or cross a highway from any public or private property, or an alley, shall yield the right-of-way to all traffic … approaching on the highway close enough to constitute an immediate hazard, and shall continue to yield the right-of-way to that traffic until they can proceed with reasonable safety.
(b) A driver having yielded … may … enter or cross the highway, and the drivers of … vehicles approaching on the highway shall yield the right-of-way to the vehicle entering or crossing the intersection.” (CVC § 21804). Traffic, as used in this section, means pedestrians, bicycles, and passenger cars.
What Are The Intersection Accident Statistics?
As we noted during the introduction, the Federal Highway Administration (FHA) has reported around 40% of all U.S. accidents to occur at intersections. (2013 study estimated 5.8 million crashes in 2012 were at or near an intersection).
What Are Some Common Injuries Caused During Intersection Accidents?
- Broken bones (broken wrists, skulls, and arms are common with vehicle drivers hit at intersections)
- Spinal cord injuries (including quadriplegia, paraplegia, and other forms of paralysis and nerve damage)
- Soft tissue injury (including whiplash neck injuries from spinal hyper-extension and bruising),
- Lacerations, in the event of a head-on collision, or T-boning, drivers and occupants can be ejected from their vehicle through safety glass, causing facial cuts and abrasions and brain injuries)
- Head or traumatic brain injuries (TBI), including a mild traumatic brain injury (MTBI) or closed head injury, remain common in intersection accidents from ejecting and your head banging against your seat’s headrest. You can also smack the window or get hit by flying objects like heavy laptop computers. Learn more about our Los Angeles brain injury attorneys.
- Wrongful Death: Remarkably, approximately 30% of intersection accidents in Los Angeles will result in a person’s death, according to the below data collated during the COVID-19 stay-at-home orders. Intersection accident victims can die instantly or pass away from their injuries later. So you may need to hire a wrongful death lawyer sooner than you think.
What Are Top Six Most Dangerous Los Angeles County Intersections?
 Los Angeles intersections reported the greatest number of traffic accidents from 2019-2020’s COVID-19 lockdown period?
The following intersections tied for most dangerous:
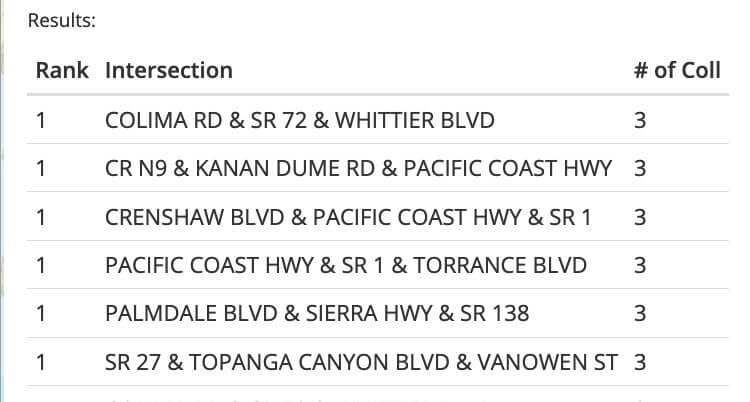
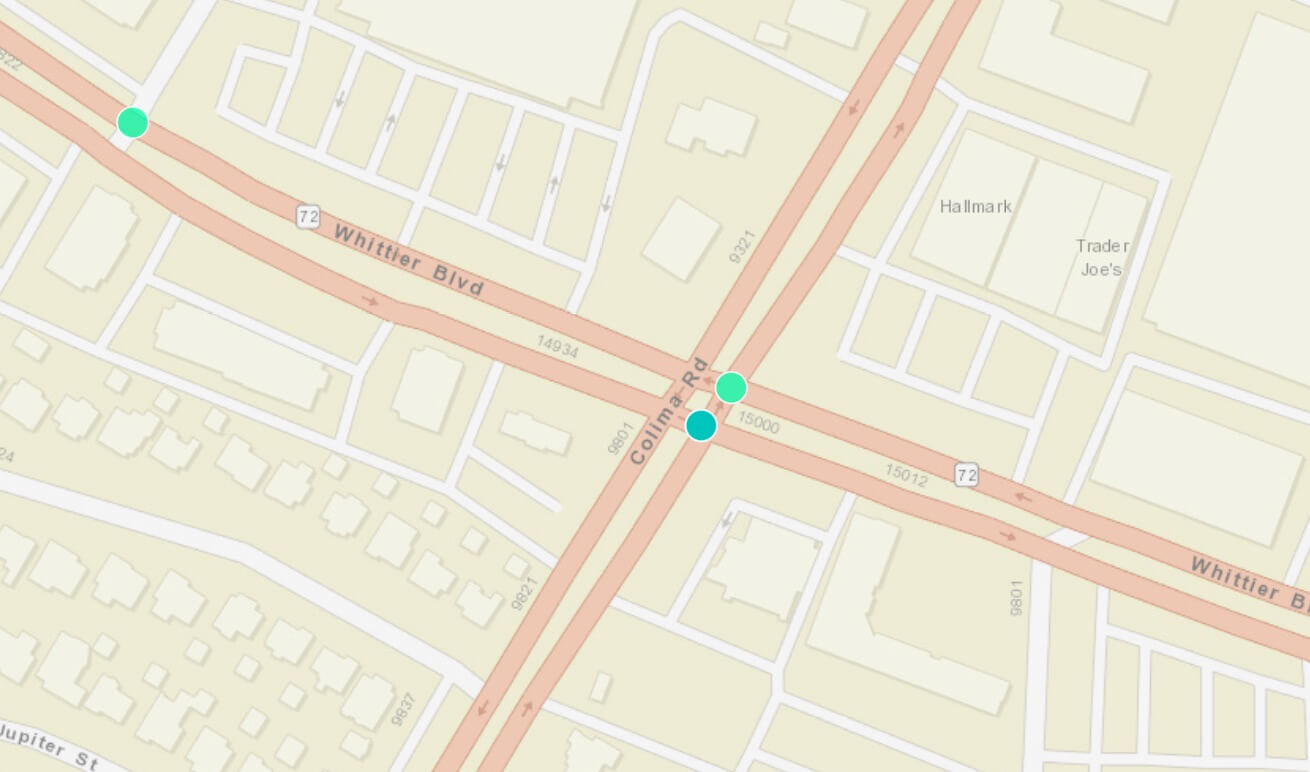
1. Colima Road and SR-72 and Whittier Blvd. (3 collisions)
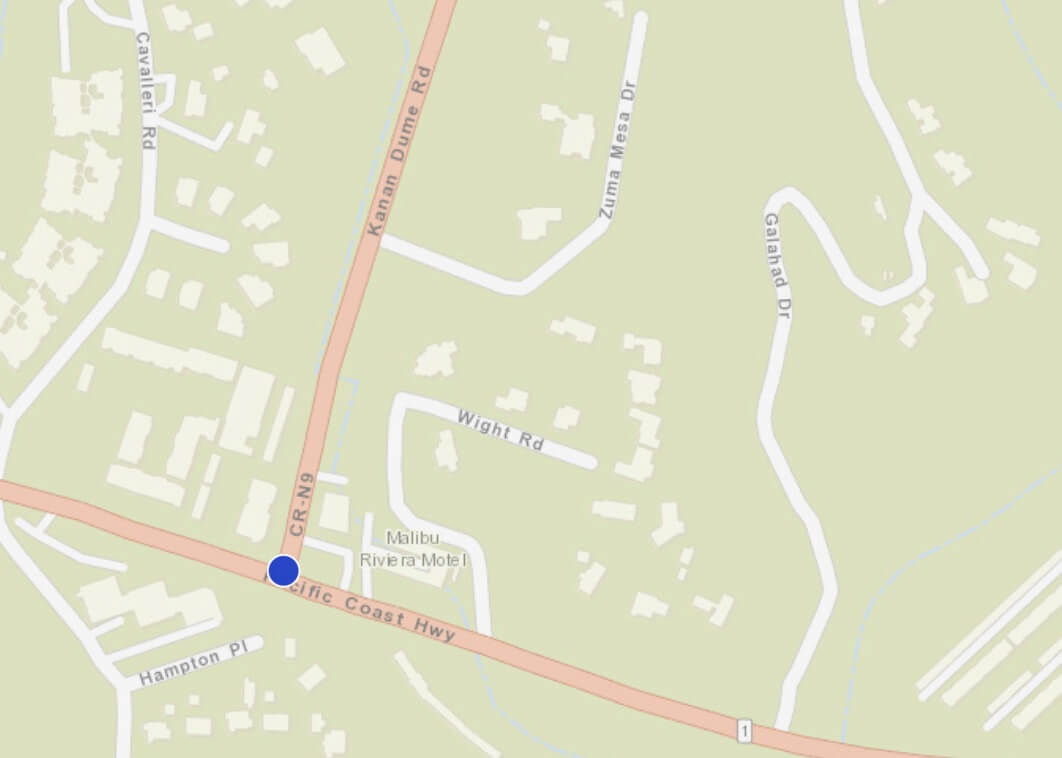
2. CR N9 and Kanan Dume Road, and Pacific Coast Highway. (3 collisions)
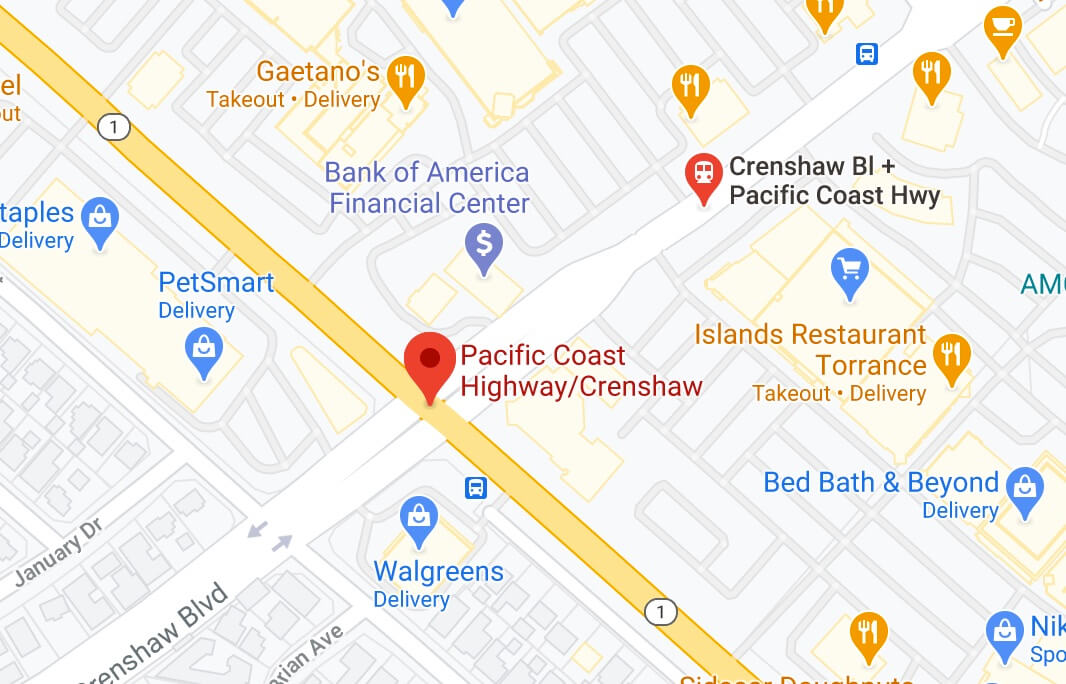
3. Crenshaw Blvd and Pacific Coast Highway and SR-1. (3 collisions)
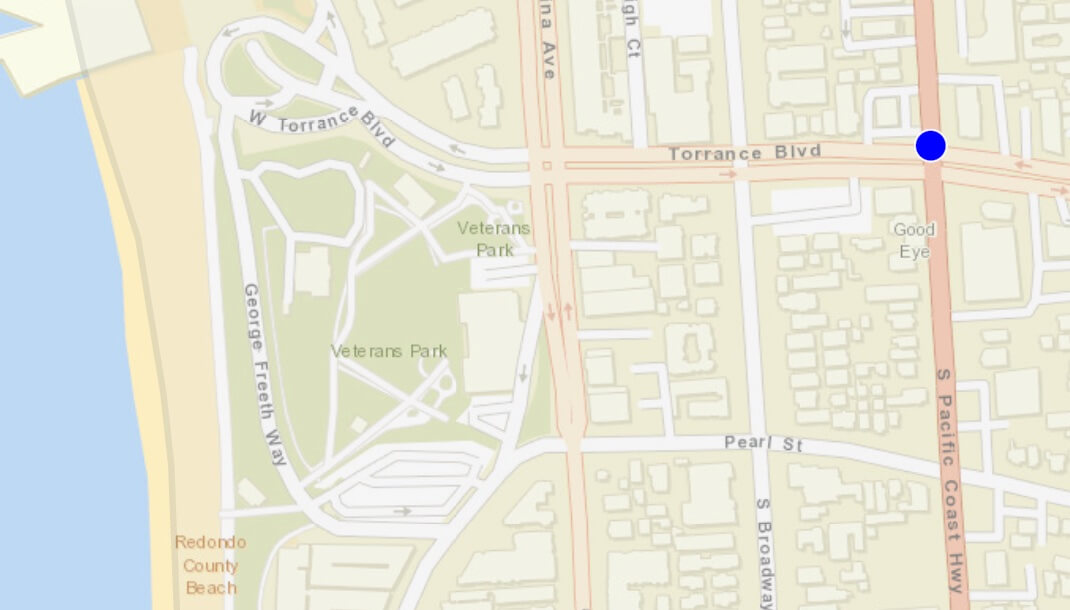
4. Pacific Coast Highway and SR-1 and Torrance Blvd. (3 collisions)
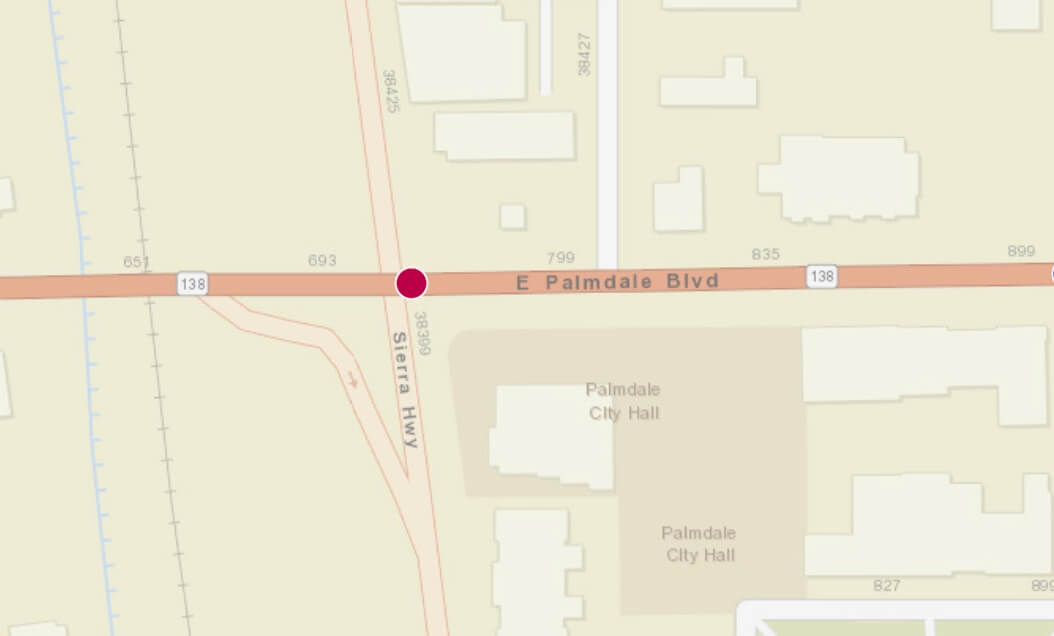
5. Palmdale Blvd and Sierra Hwy and SR-138. (3 collisions)
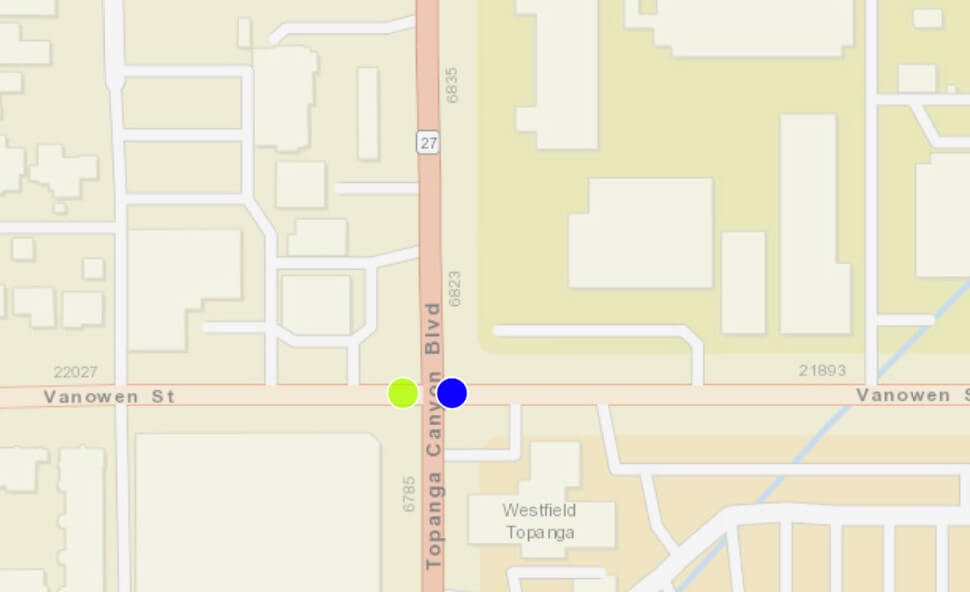
6. SR-27 and Topanga Canyon Blvd and Vanowen Street. (3 collisions)
What Are The Main Intersection Accident Injury Types In Los Angeles?
Although intersection collisions are the second-leading cause of traffic accidents in the U.S., Los Angeles intersections are more dangerous than anywhere else. Injuries you can sustain will vary depending on the collision itself. Even at low impact speed, severe injury cases and wrongful death claims can arise from these accident types.
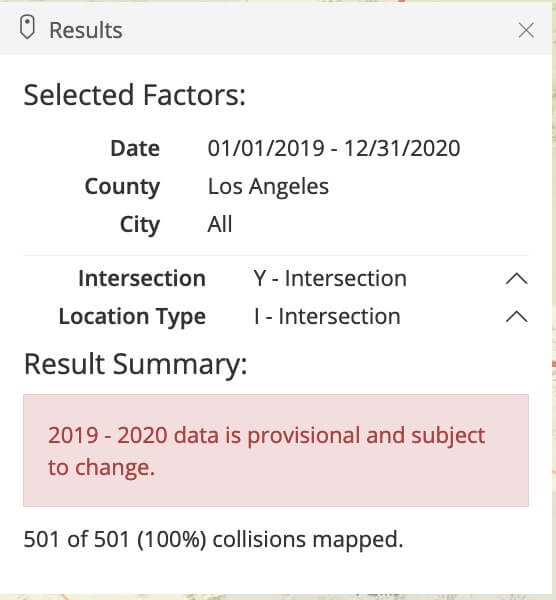
According to SWITRS, from 2018-2020, Los Angeles County saw:
- 168,240 total auto accidents, with 2,091 victims killed & 242,529 people seriously injured.
- During that same period, 59,942 angle crashes occurred at L.A. intersections, with 92,522 victims in and out of vehicles.
Of these reported L.A. intersection collisions, 535 people were killed & 91,989 people in vehicles received injuries
- Ped Collisions: 6,200. (10.3%)
- Bike Collisions: 4,131. (6.9%)
- Motorcycle Collisions: 3,226. (5.4%)
The personal injury attorneys at Ehline Law believe negligent and reckless drivers contributing to a crash at an intersection should be held accountable.
Main Victims Arising From Los Angeles Intersection Accidents From 2018-2020?
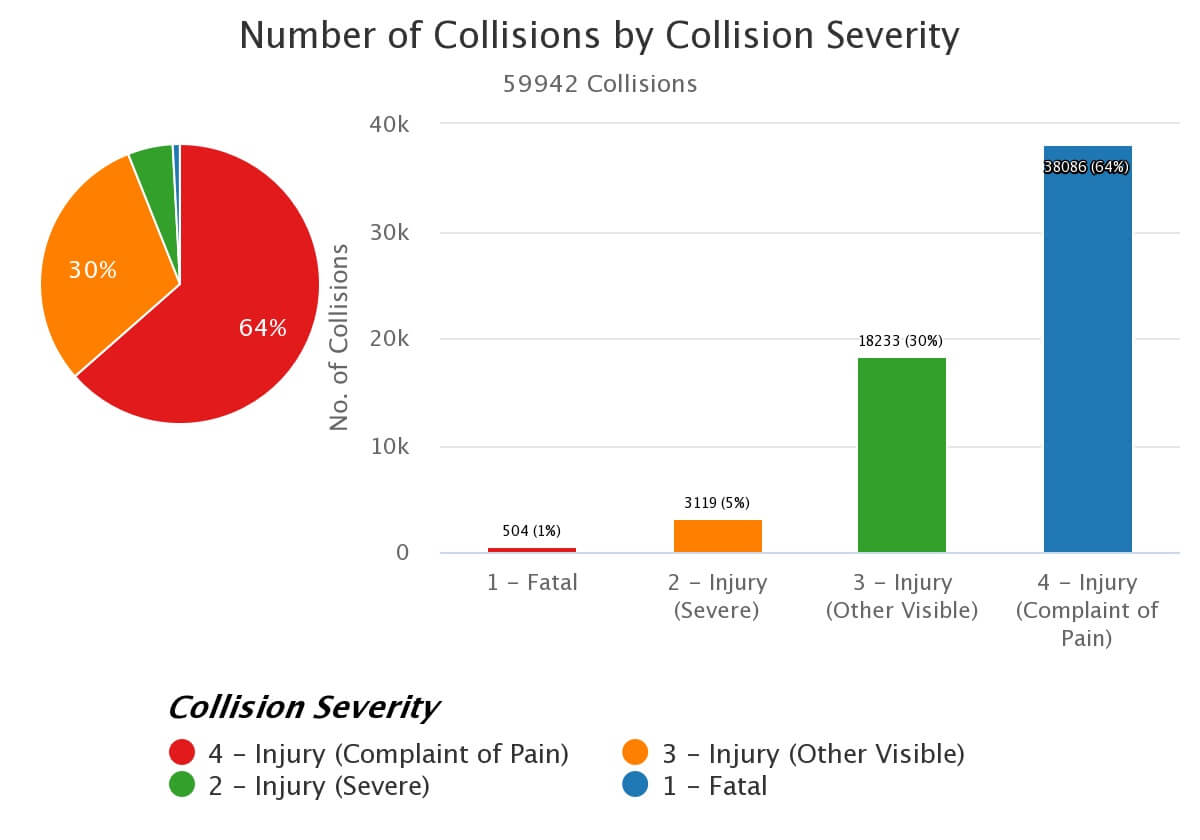
Collision Severity
|
Collision Severity |
Count |
% |
|
4 – Injury (Complaint of Pain) |
38086 |
63.54% |
|
3 – Injury (Other Visible) |
18233 |
30.42% |
|
2 – Injury (Severe) |
3119 |
5.20% |
|
1 – Fatal |
504 |
0.84% |
Victims Role By Degree of Injury
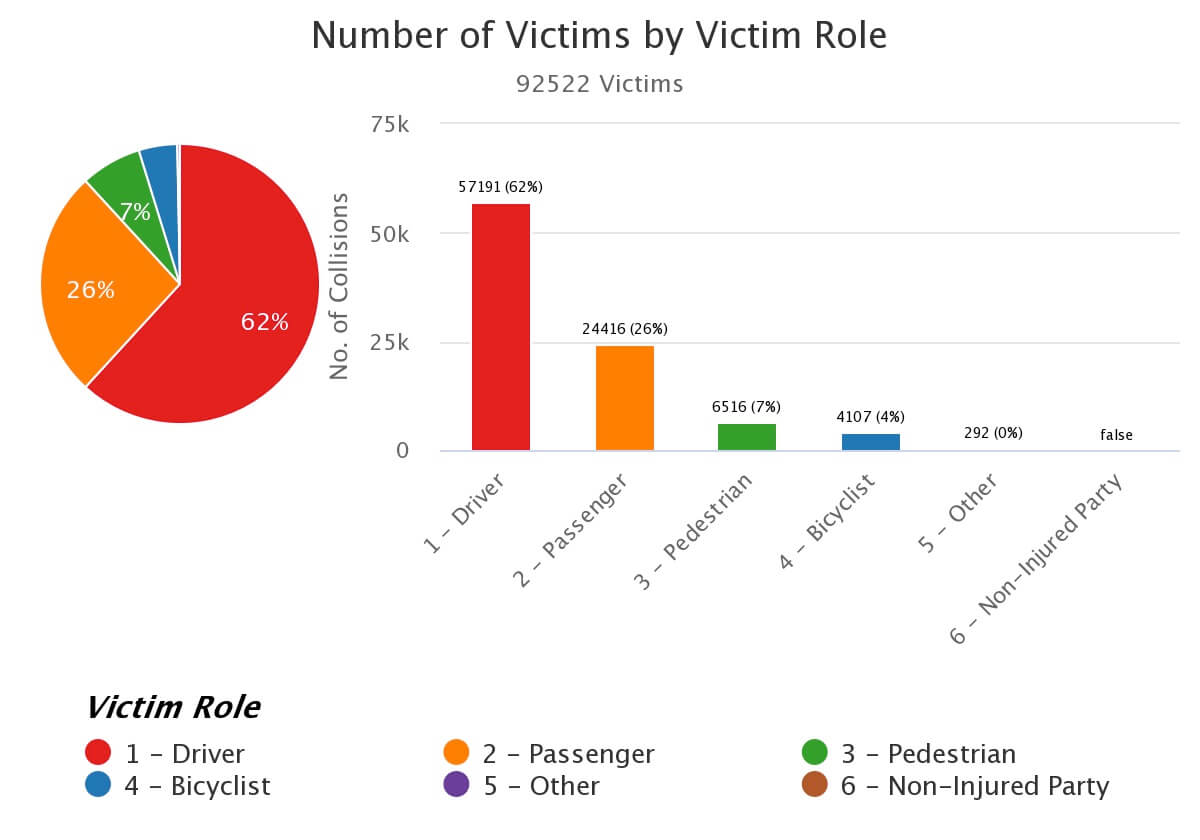
|
Victim Role |
Count |
% |
|
1 – Driver |
57191 |
61.81% |
|
2 – Passenger |
24416 |
26.39% |
|
3 – Pedestrian |
6516 |
7.04% |
|
4 – Bicyclist |
4107 |
4.44% |
|
5 – Other |
292 |
0.32% |
At-Fault Party Age As A Factor?
- Mature drivers: (65 years or older) are more likely to be involved in intersection crashes, according to the NHTSA. Intersections may be confusing, creating many problems for more senior, mature drivers. (many elders drive while using prescription meds like Xanax and Prozac as well). In Los Angeles, from 2019-2020.
- Younger drivers: (males 24 years and under) at intersections controlled by a traffic signal are likely due to internal vehicle distractions, falsely assuming another driver’s route, driving too fast for safe conditions, or aggressive driving with external distractions.
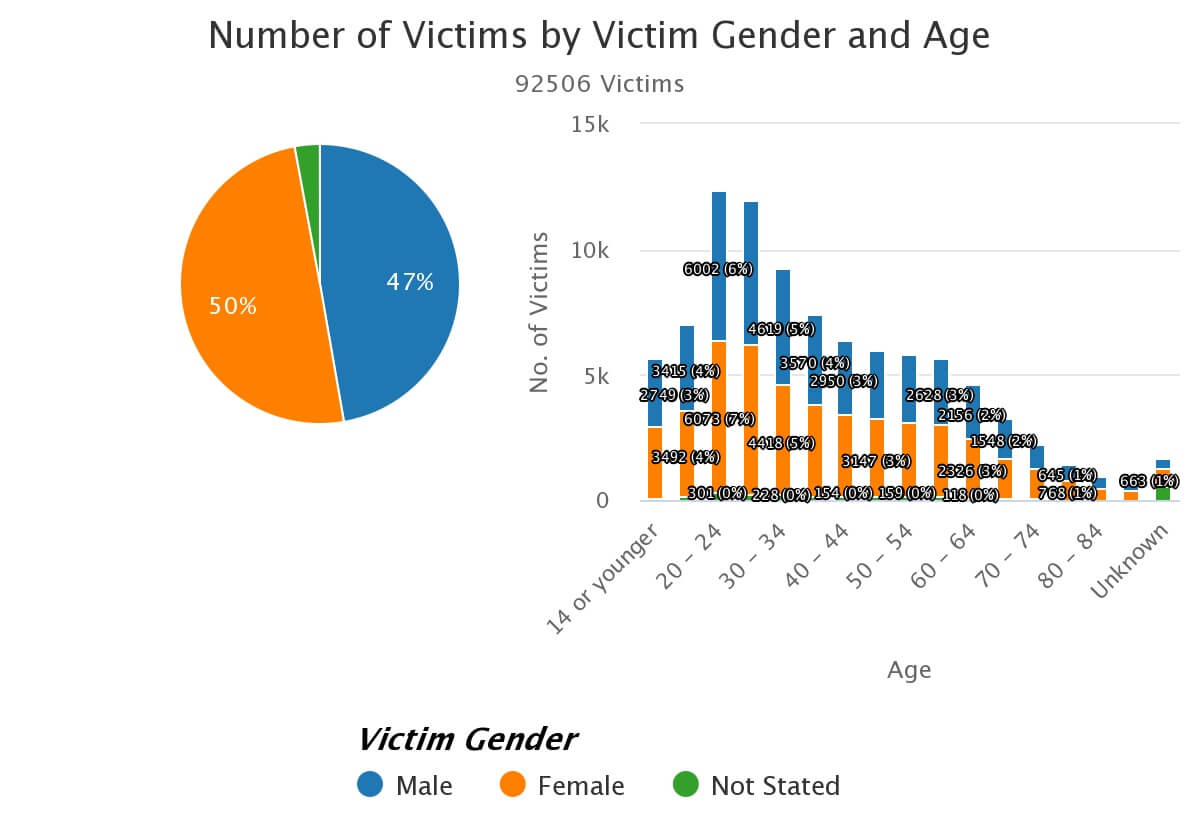
Victim’s Age As A Factor?
According to SWITRS, from 2018-2020, out of 92,506 Los Angeles angle crash victims, more female victims were present than males 20-24 years of age.
-
-
-
-
-
- Males: 6,002. (6%)
- Females: 6,073. (7%)
-
-
-
-
What Are The Most Common Types Of Los Angeles Intersection Accident Claims?
Most pedestrian crashes and deaths occur while pedestrians are crossing a street’s intersection. Most bicyclists are killed by cars at intersections.
-
-
-
-
-
-
Pedestrian Accidents often happen at Intersections.
-
-
-
-
-
|
Type of Collision |
Count |
% |
|
D – Broadside |
34085 |
56.86% |
|
A – Head-On |
6956 |
11.60% |
|
G – Vehicle/Pedestrian |
5403 |
9.01% |
|
C – Rear End |
5169 |
8.62% |
|
B – Sideswipe |
4515 |
7.53% |
|
H – Other |
1303 |
2.17% |
|
‘- – Not Stated |
1105 |
1.84% |
|
E – Hit Object |
1058 |
1.77% |
|
F – Overturned |
348 |
0.58% |
What Are The Top Los Angeles Intersection Traffic Violations Present In Most Collisions?
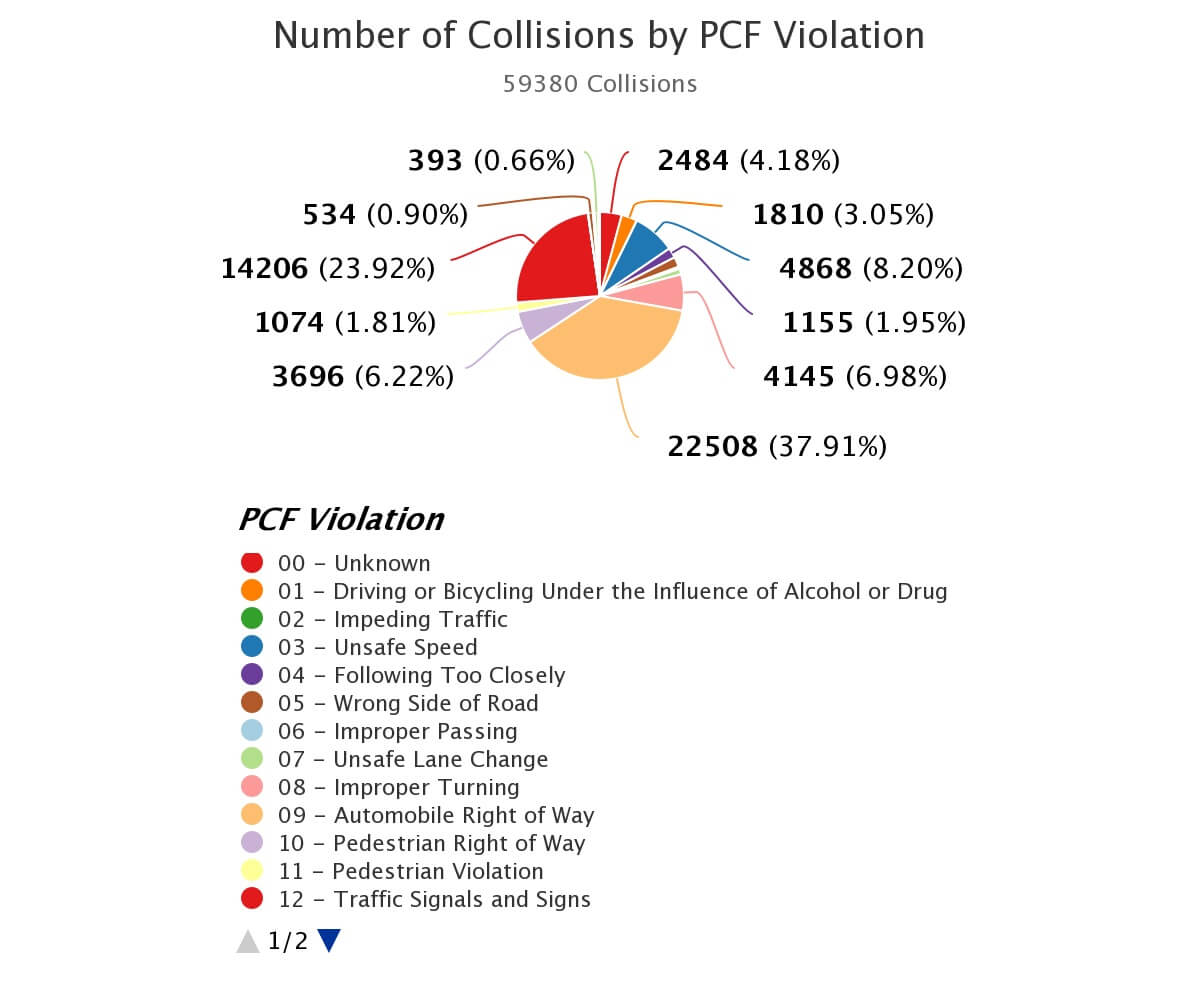
|
PCF Violation |
Count |
% |
|
00 – Unknown |
2484 |
4.18% |
|
01 – Driving or Bicycling Under the Influence of Alcohol or Drug |
1810 |
3.05% |
|
02 – Impeding Traffic |
13 |
0.02% |
|
03 – Unsafe Speed |
4868 |
8.20% |
|
04 – Following Too Closely |
1155 |
1.95% |
|
05 – Wrong Side of Road |
1151 |
1.94% |
|
06 – Improper Passing |
259 |
0.44% |
|
07 – Unsafe Lane Change |
641 |
1.08% |
|
08 – Improper Turning |
4145 |
6.98% |
|
09 – Automobile Right of Way |
22508 |
37.91% |
|
10 – Pedestrian Right of Way |
3696 |
6.22% |
|
11 – Pedestrian Violation |
1074 |
1.81% |
|
12 – Traffic Signals and Signs |
14206 |
23.92% |
|
13 – Hazardous Parking |
12 |
0.02% |
|
14 – Lights |
2 |
0.00% |
|
15 – Brakes |
16 |
0.03% |
|
16 – Other Equipment |
10 |
0.02% |
|
17 – Other Hazardous Violation |
534 |
0.90% |
|
18 – Other Than Driver (or Pedestrian) |
199 |
0.34% |
|
21 – Unsafe Starting or Backing |
393 |
0.66% |
|
22 – Other Improper Driving |
203 |
0.34% |
|
24 – Fell Asleep |
1 |
0.00% |
Negligence Per Se
Some accidents are due to pure negligence but not violations of legislative enactments. But some roadway law violations violate local laws. When a motorist violates a traffic law (makes a left-hand turn when the static or lit traffic signal is still red), victims recover compensation easier based upon a presumption they were negligent by ignoring the posted regulations. Violating the California Vehicle Code is negligence per se, meaning victims won’t be burdened to prove the at-fault driver was negligent.
Here, the defendant who crashed into you might be presumed negligent by violating the below laws. Unless the other driver can shift the burden back at you, they are up the creek without a paddle. (Read More about negligence per se here)
Los Angeles Car Accident Attorney Answers:
Once you or your representative determines who violated the law, your Los Angeles car accident attorneys must look for other parties who may have liability for the other driver or some road condition, increasing accident risks.
Who Is At Fault To Pay For My Intersection Crash Damages?
Whether you were hit at a controlled or uncontrolled intersection, you have the right to recover full and fair compensation.
Potentially At-Fault-Parties Include:
- The other driver,
- Their employer: If the at-fault party was working, you could seek money from their employer and them.
- A government agency,
- Another private company, including an automaker, parts manufacturer, livery, or commercial delivery vehicle service agency.
- An auto or auto parts maker may have produced a bad car part or failed to warn about a weak roof or some tendency to make the vehicle un-crashworthy.
In the event of an accident, especially when drivers do not come to a complete stop at a stop sign, drivers entering the intersection at the main thoroughfare have the right of way first. And those drivers approaching from secondary roads must wait till they can safely proceed. That is the law!
Yes, we may find evidence that other parties must contribute money to your compensation amount. So this means they would typically be at fault for helping cover your medical expenses, lost wages, loss of income, loss of consortium, replacement vehicle, and more.
Can I Recover Money From My No-Fault Work-Comp Insurance?
If you were on the clock, you might be eligible to receive worker’s compensation insurance payments, including unemployment disability.
SPECIAL PROBLEM: How Do You Dispute Fault in a “Green/Green” Light?
You already know that drivers failing to stop or who stop but carelessly pull out into oncoming traffic are negligent under California law.
Placing Blame Is Hard In Intersection Accidents?
Yes, intersection accidents can be tricky. First, you have to prove you had the right of way. How do you prove the other driver liable when you both have asserted you had a green light?
- Often, both insurance companies pay what they believe is their share of fault under California’s pure comparative negligence laws.
- Failing to Stop At A Red Sign Completely.
Partial Fault/Clear Comparative Negligence Examples, Explanations
You may bear some fault in causing or contributing to the accident and making your injuries worse after the accident.
- For example, You veer too hard while taking evasive action and run into city property head-on.
- For example, You refuse hospital care and go on your planned hiking trip while still in shock after crashing. Now your whiplash is a full-blown disc, requiring pain-killing cortisone injections, prolotherapy, or disc replacement – Pro Disc) surgery.
Your recovery is not barred in these cases, but your damages award will be reduced based on your fault percentages.
How Much Money Can My Los Angeles Car Accident Lawyer Get Me?
How much money you can receive from an at-fault party will be determined on a case-by-case basis, based upon your percentage of fault, if any, and your total general and special damages.
- General Damages: include pain, suffering, loss of consortium, and other intangible emotional losses.
- Special Damages: these will include money for past, present, and future medical expenses, lost income, and other services the survivor or decedent no longer contributes to your household.
Our magnificent intersection accident lawyers will use their superior knowledge and skills to retrieve the maximum compensation award under the law.
5 Tips To Staying Safe At Los Angeles Intersections
Driving at or near intersections remains one of the most dangerous places for vehicle operators in L.A. However, young people and elders drive in and out of many local intersections each day, rarely imagining the risks they pose. Most crashes in L.A. County happen at an intersection. Since you can’t avoid passing through every intersection, we have provided several tips to help you safely navigate them.
- Pay attention to your local surroundings. DTLA, in particular, has many crazy one-way streets. Knowing this is part of noticing your surroundings and being vigilant. You must constantly be scanning for drivers near your vicinity. You must account for intersections blocking intersection direction visibility. For example, a hedgerow, commercial building, trees, construction equipment, and other vehicles can block your eyesight from oncoming trucks, buses, and cars. Pedestrians crossing streets must be particularly mindful, as most people walking, jogging, or running are hurt at intersections. Experts at the DOT suggest approximately 44.1% of intersection collisions are caused by drivers failing to surveil their surroundings. (Read More).
- Don’t speed up at intersections! You can never anticipate another driver’s anticipated course of movement at an intersection. According to the NHTSA, approximately 8.4% of intersection collisions occur when you assume other drivers’ actions. If you speed up or drive too fast, you’ll have less reaction time to adjust or safely evade another driver’s unexpected turn at a yellow light. Humans need time to react to a sudden lane change or screeching stop. Do not race through intersections. If anything, slow down a little bit and be prepared to stop for a traffic signal turning red completely.
- Keep your cushion of space distance. You must never follow the vehicle in front of you too closely as you prepare to pass through an intersection. Because you know accidents are common here, don’t you agree you should use common sense and provide a few feet of space to help you escape a potential crash? Even in driving education classes, they teach you to surround your vehicle with a “cushion of space.”
- Use your turn signal: Many people refuse to use turn signals in California since other drivers tend to speed up when you demonstrate your intentions to change lanes or slow for a turn. But it’s the law. You must use common sense and turn on your signals far enough back from the arch, so you don’t anger, frustrate or confuse other drivers.
- Use caution entering intersections: The most dangerous time for you to enter an intersection is yellow light or just after a red turns green. As mentioned already, when the light turns yellow, many people will try to beat the light. You must carefully enter the intersection, regardless of your right-of-way, especially at a four-way stop intersection. You must be constantly and carefully scan the intersection and traffic from opposite directions.
Act Now To Protect the Statute Of Limitations
In most personal injury cases, the victim will have two years from the date of the accident to file a lawsuit for personal injuries and three years to sue for property damage. But in a cruise ship accident or case against a government agency, you may have other problems. Only a highly trained, expeditious injury law firm will handle all these issues with confidence.
We provided these tips to keep you safe when driving through an intersection. You should teach your teen driver and spouse about these dangers. Being a good citizen means developing excellent, safe driving habits. When you have suffered harm in an intersection accident caused due to another’s negligence, you will endure bills, lost wages/profits, immense pain, and suffering.
Get Your Free Legal Consultation From A California Intersection Accident Law Firm Today
Our superior Los Angeles intersection accident attorneys think you deserve compensation. Our legal team and charismatic staff offer the best legal representation in Southern California. We have the legal know-how and financial wherewithal to investigate any intersection accident and determine party fault comprehensively. Also, we have vast experience negotiating with sneaky insurance adjusters.
Our award-winning trial lawyers have no fear of filing a lawsuit either. We are experts at law and motion and complex civil litigation. We encourage seriously injured accident victims to reach out to Ehline Law Firm Personal Injury Attorneys, APLC, today. We have a proven track record for helping California accident victims. We have recovered over $150 million for satisfied clients.
And we only get paid attorney’s fees if we get you money. You can call us toll-free at (213) 596-9642 24 hours a day, seven days a week, at our injury attorney hotline. You and your family members can also use our convenient online contact form to receive your free legal consultation at no charge!
SCHEDULE A FREE LEGAL CONSULTATION FROM A TOP-RATED INTERSECTION ACCIDENT LAWYER IN LOS ANGELES TODAY!
Fill out this contact form to schedule your free consultation. One of our serious injury lawyers will respond to your query within 24 hours. We will fight for MAXIMUM compensation and never surrender. No recovery and no fee unless you get paid. Dial (213) 596-9642 for superior trial lawyers handling intersection accidents today!